Table of Contents
- 1. Introduction to Analytics Dashboard
- 2. Key Features Overview
- 3. Top Performing Links Analysis
- 4. Geographic Click Distribution
- 5. Real-Time Click Tracking
- 6. Click Trends Analysis
- 7. Browser & Device Analytics
- 8. AI-Powered Performance Intelligence
- 9. Advanced Date Filtering
- 10. Best Practices & Optimization
- 11. Real-World Use Cases
Introduction to Analytics Dashboard
yLnk's Analytics Dashboard is a comprehensive performance intelligence platform designed to provide deep insights into your shortened URL performance. While basic URL shorteners offer simple click counts, our analytics dashboard delivers enterprise-grade intelligence that helps you understand not just how many clicks you're getting, but where they're coming from, when they happen, and what drives your best performance.
Whether you're a marketer tracking campaign performance, a business owner monitoring link effectiveness, or a content creator understanding audience behavior, the Analytics Dashboard provides the tools you need to make data-driven decisions and optimize your link strategy.
Why Choose yLnk Analytics?
- Real-Time Intelligence: Get instant updates on click activity and performance
- Geographic Insights: Understand where your audience is located globally
- AI-Powered Analysis: Intelligent performance scoring and trend detection
- Comprehensive Tracking: Browser, device, and platform analytics
- Advanced Filtering: Date range filtering with up to 10-day analysis
- Performance Optimization: Identify and replicate your best-performing content
Key Features Overview
The Analytics Dashboard includes a comprehensive suite of features designed to provide complete visibility into your link performance:
Top Performing Links
AI-ranked high-performance URLs with intelligent performance scoring. Identify your best-performing content and understand what drives success.
Geographic Distribution
Interactive world map showing click distribution by country. Understand your global audience and optimize for different regions.
Real-Time Tracking
Live click monitoring with instant updates. Track performance as it happens and respond to trends immediately.
Click Trends Analysis
Time-series analysis showing click patterns over time. Identify trends, seasonal patterns, and growth opportunities.
Top Performing Links Analysis
The Top Performing Links section uses AI-powered intelligence to rank your URLs based on multiple performance factors, not just click count. This helps you identify truly successful content and understand what drives engagement.
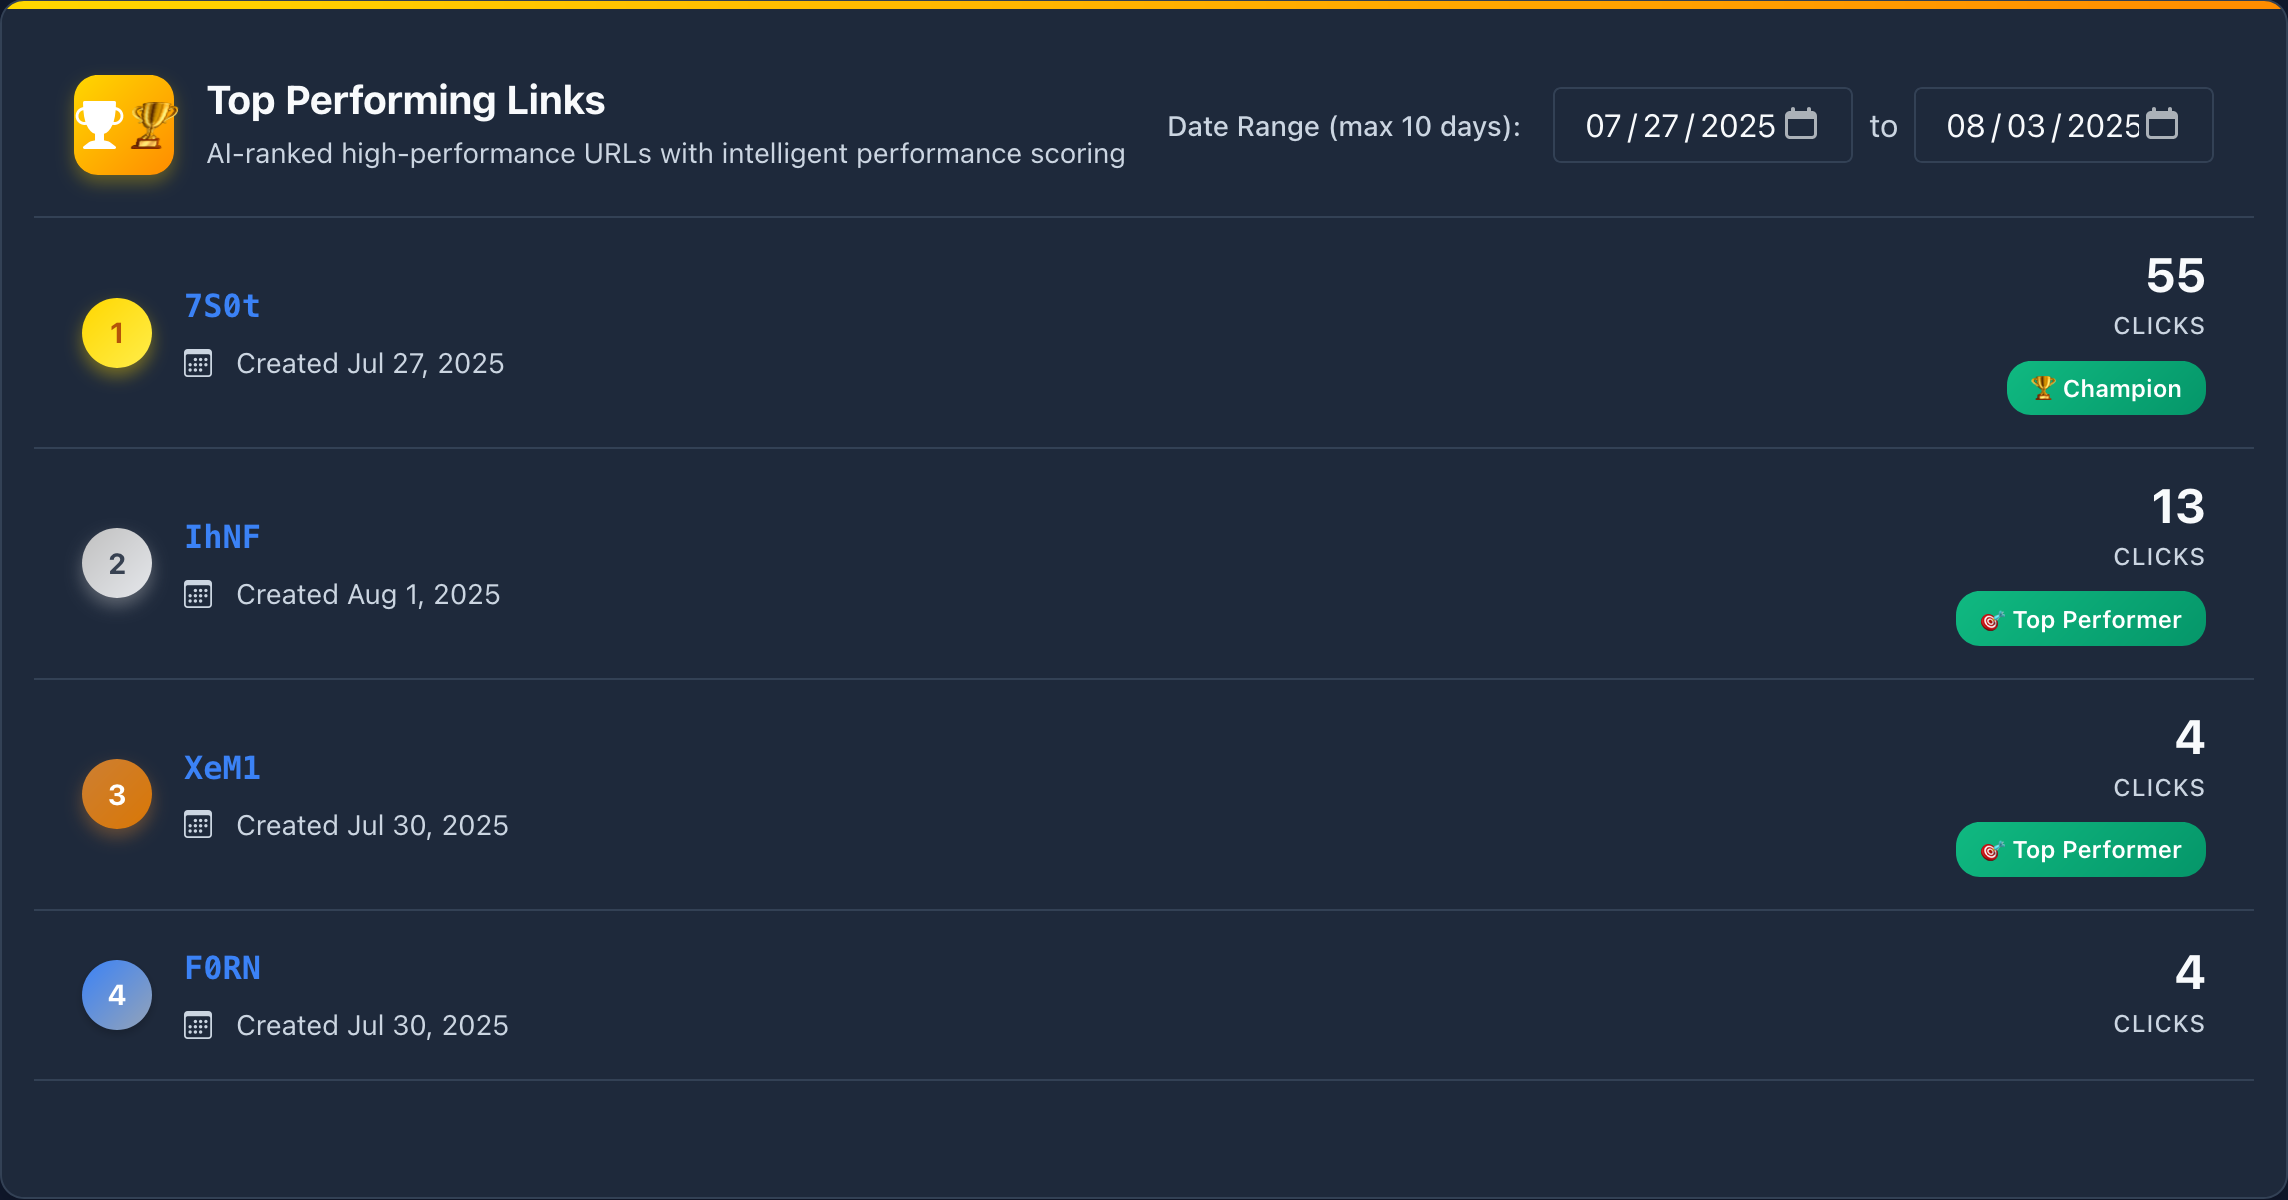
Top Performing Links Interface
AI Performance Scoring
The system analyzes multiple factors to determine link performance:
- Click Volume: Total number of clicks and click velocity
- Geographic Reach: Number of countries and regions reached
- Engagement Quality: Time spent and interaction patterns
- Growth Rate: Acceleration of click growth over time
- Platform Performance: Success across different sharing platforms
Understanding Performance Scores
- High Score (90-100): Exceptional performance across all metrics
- Good Score (70-89): Strong performance with room for optimization
- Average Score (50-69): Decent performance, consider improvements
- Low Score (0-49): Needs attention and optimization
Date Range Filtering
Analyze performance over specific time periods:
- Select your desired start and end dates (maximum 10 days)
- The system will recalculate performance scores for that period
- Compare performance across different time frames
- Identify seasonal patterns and campaign effectiveness
Geographic Click Distribution
The Geographic Distribution feature provides an interactive world map showing where your clicks are coming from. This is invaluable for understanding your global audience and optimizing your content for different regions.
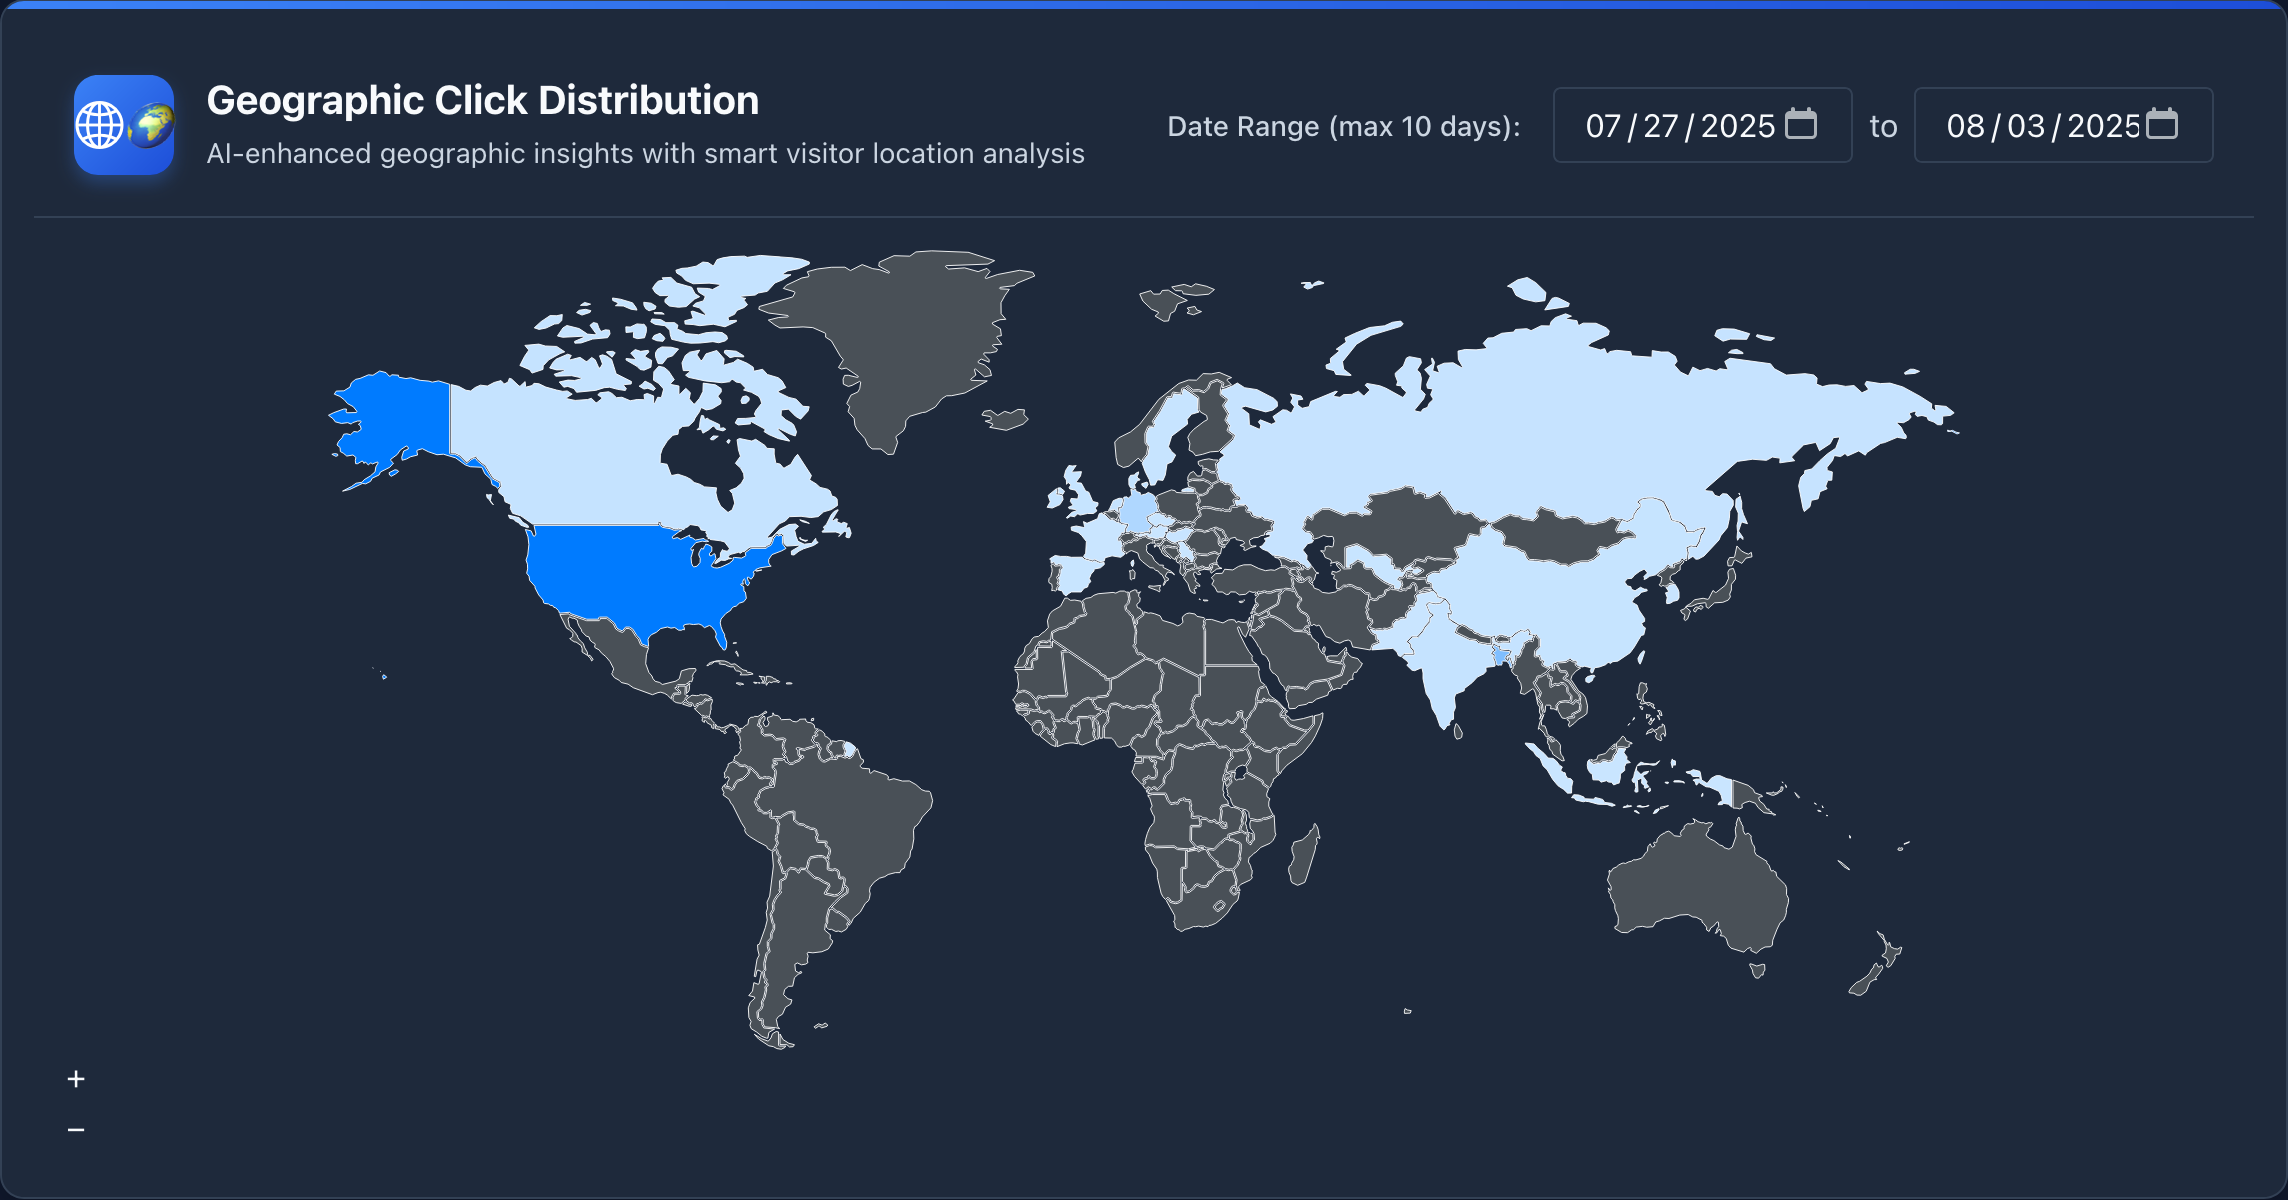
Geographic Distribution Heatmap
Interactive World Map Features
- Heat Map Visualization: Color-coded countries based on click volume
- Country Details: Click on any country for detailed statistics
- Regional Analysis: Compare performance across continents
- Time-based Filtering: See geographic patterns over different time periods
Geographic Insights Use Cases
- Market Expansion: Identify new markets with high engagement
- Content Localization: Optimize content for your top-performing regions
- Campaign Targeting: Focus marketing efforts on high-potential areas
- Time Zone Optimization: Schedule content for peak activity times
Country-Level Analytics
Click on any country to see detailed statistics:
- Total Clicks: Number of clicks from that country
- Percentage of Total: Country's share of overall traffic
- Growth Rate: Click growth compared to previous periods
- Top Cities: Most active cities within the country
Real-Time Click Tracking
Real-time tracking provides instant visibility into click activity as it happens. This feature is essential for monitoring live campaigns, responding to viral content, and understanding immediate audience behavior.
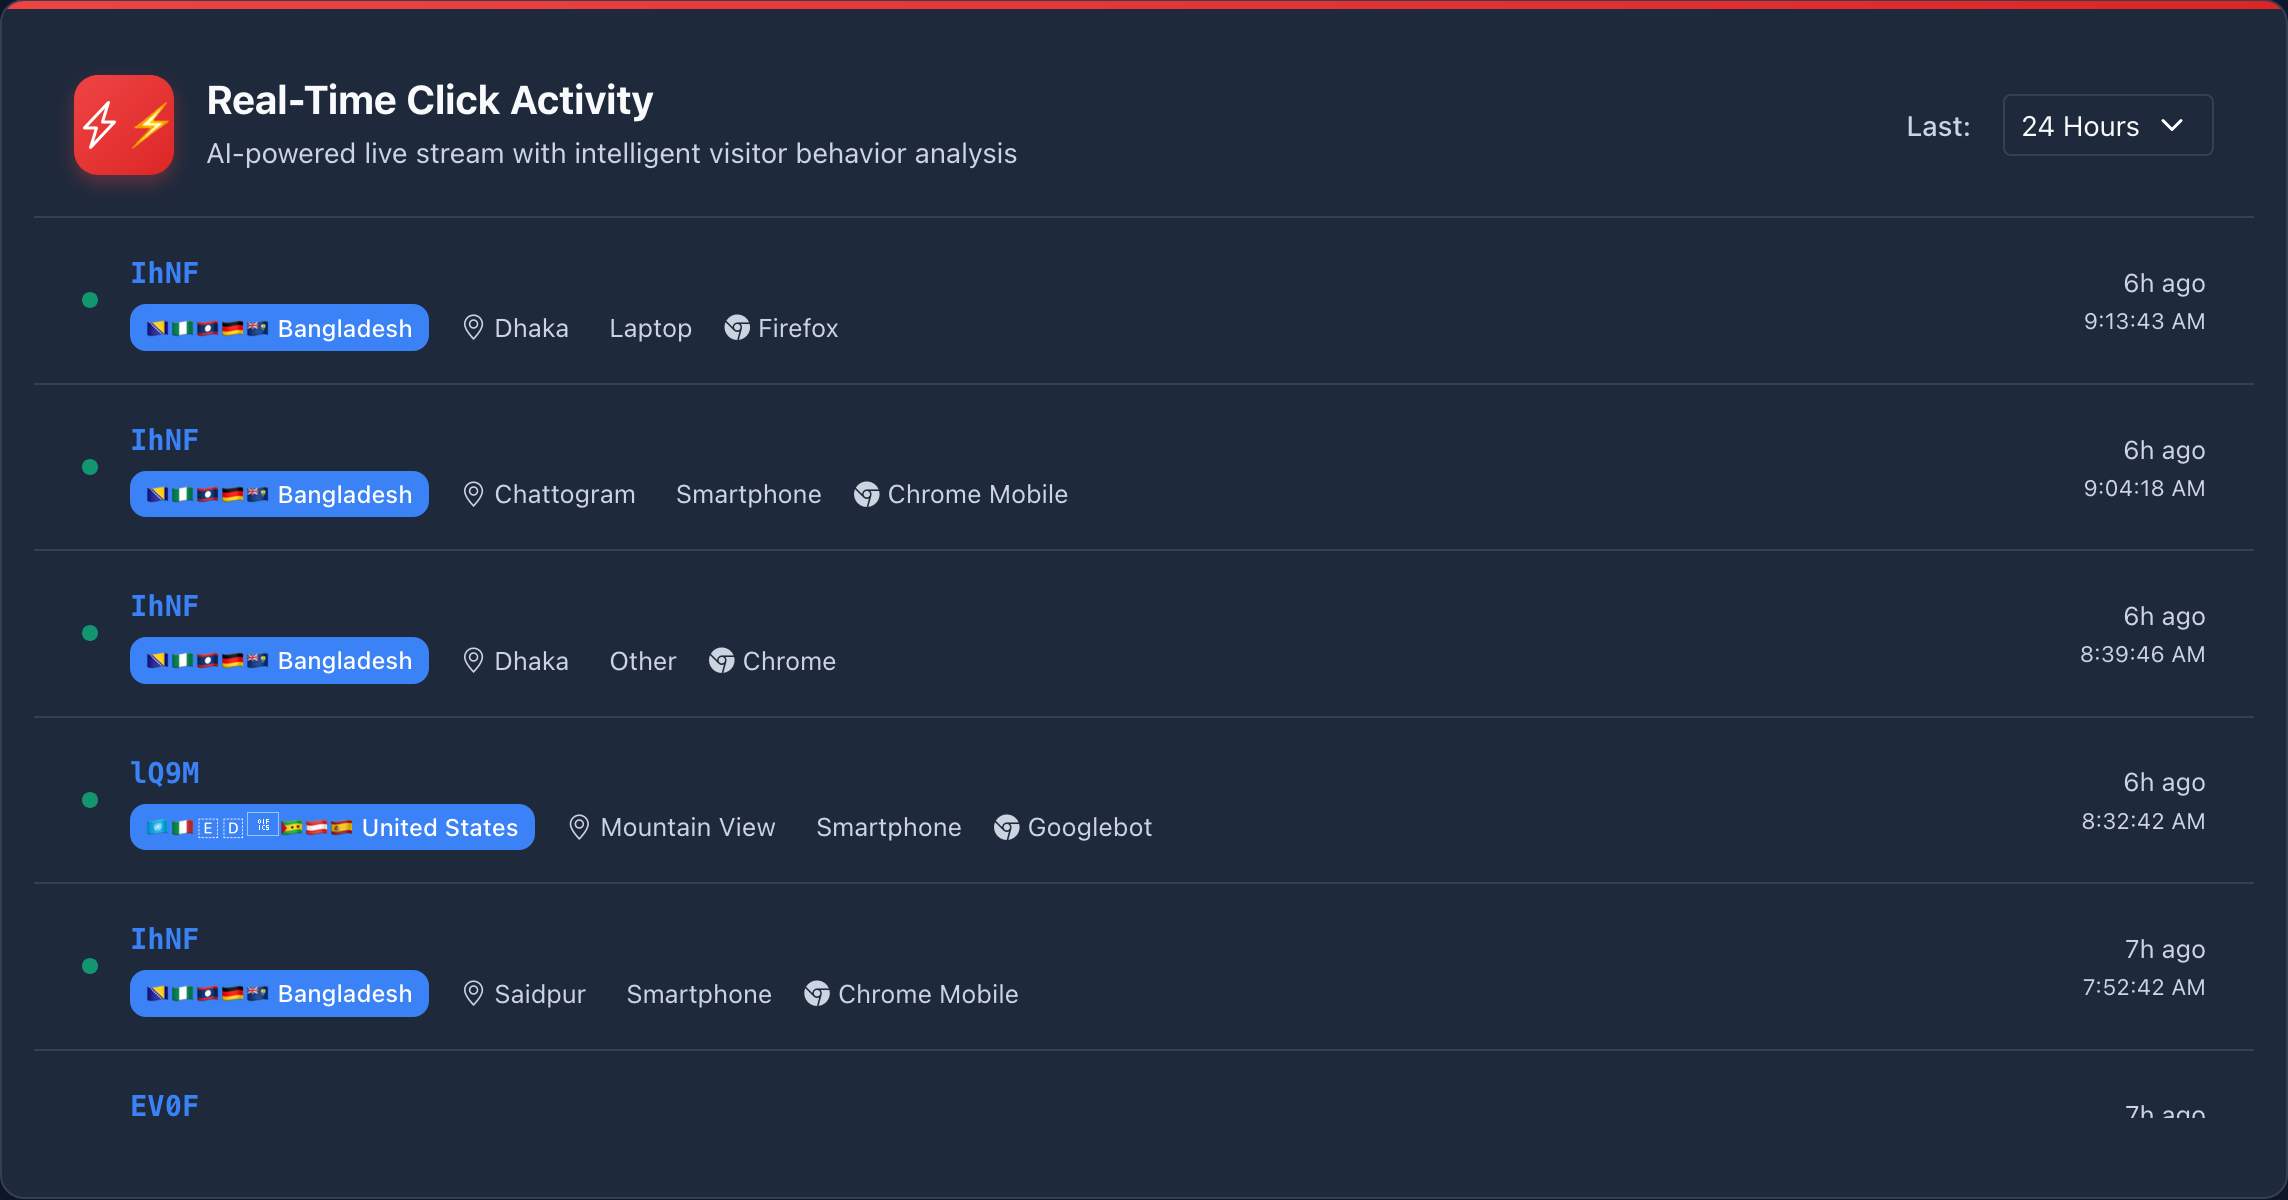
Real-Time Click Tracking Interface
Live Monitoring Features
- Instant Updates: Click activity updates in real-time
- Activity Feed: Live stream of click events
- Geographic Tracking: See where clicks are happening right now
- Device Detection: Real-time device and browser information
- Referrer Tracking: Immediate source identification
Real-Time Monitoring Best Practices
- Monitor during peak activity times for immediate insights
- Set up alerts for unusual traffic spikes
- Use real-time data to optimize live campaigns
- Track viral content performance as it spreads
Use Cases for Real-Time Tracking
Real-Time Applications
- Live Events: Monitor engagement during webinars or live streams
- Viral Content: Track the spread of viral posts in real-time
- Campaign Launches: Monitor initial response to new campaigns
- Emergency Communications: Track important announcements
Click Trends Analysis
Click Trends Analysis provides time-series data showing how your link performance changes over time. This helps identify patterns, seasonal trends, and growth opportunities.
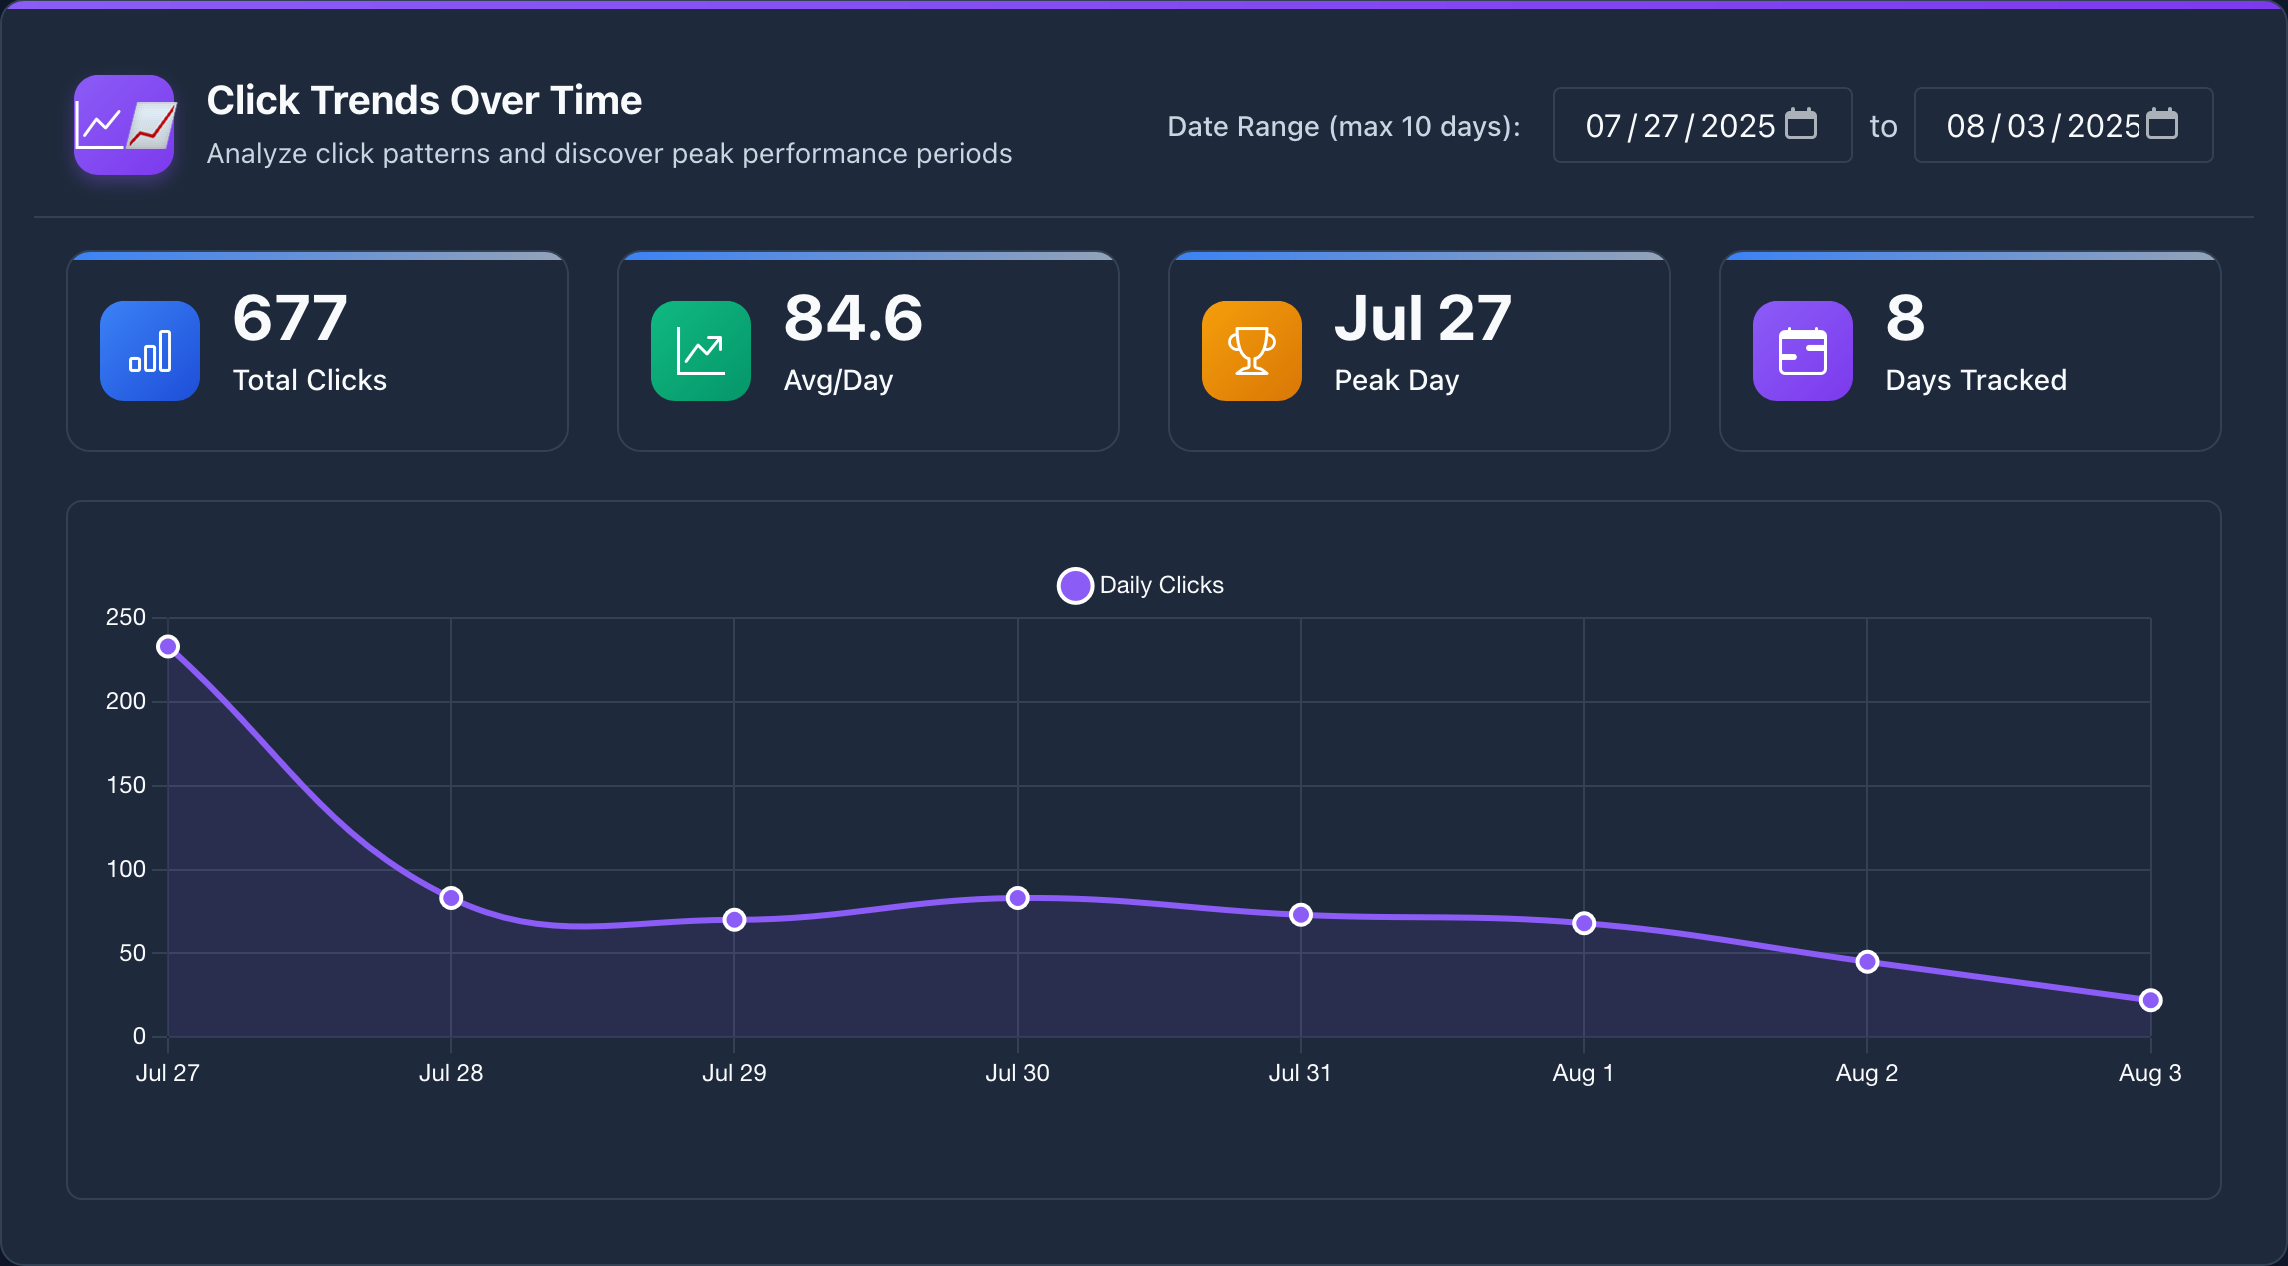
Click Trends Analysis Interface
Trend Analysis Features
- Time-Series Charts: Visual representation of click patterns over time
- Growth Analysis: Identify acceleration and deceleration periods
- Seasonal Patterns: Recognize recurring trends and cycles
- Anomaly Detection: Spot unusual activity patterns
- Comparative Analysis: Compare performance across different time periods
Understanding Trend Patterns
Common Trend Patterns
- Steady Growth: Consistent increase in clicks over time
- Viral Spikes: Sudden, dramatic increases in traffic
- Seasonal Cycles: Predictable patterns based on time of year
- Plateau Patterns: Initial growth followed by stabilization
- Decline Patterns: Decreasing engagement over time
Trend Analysis Tips
- Look for patterns that repeat across multiple links
- Identify what drives viral spikes and replicate successful strategies
- Use trend data to predict future performance
- Compare trends across different content types and campaigns
Browser & Device Analytics
Browser and Device Analytics provide detailed insights into how your audience accesses your links. This information is crucial for optimizing user experience and understanding platform preferences.
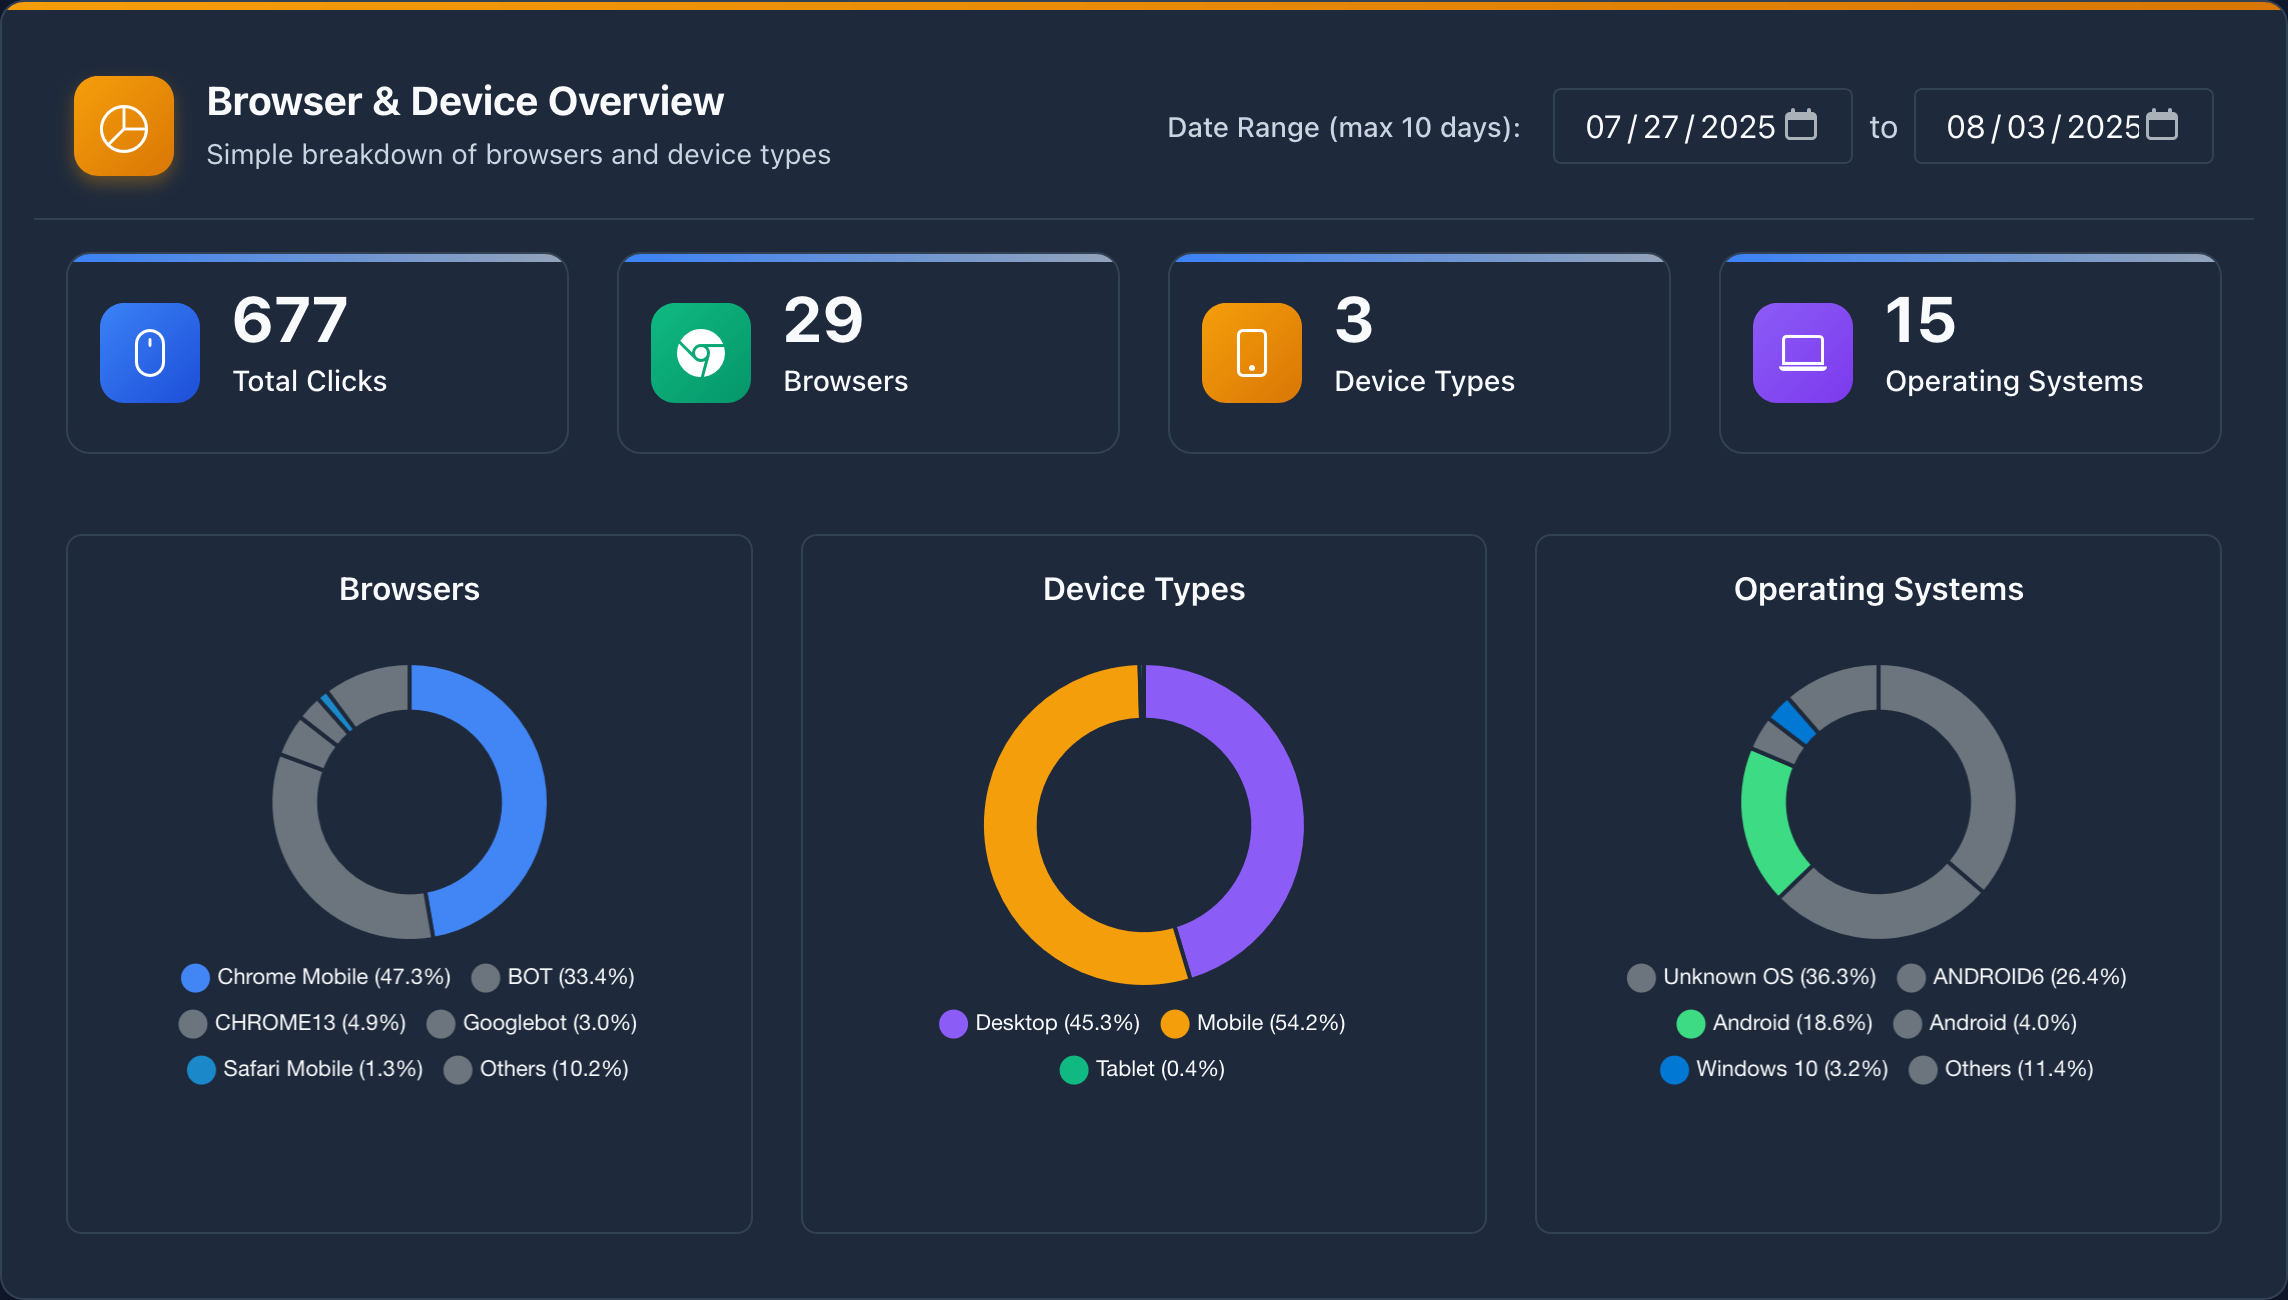
Browser & Device Analytics Interface
Browser Analytics
Understand which browsers your audience prefers:
- Chrome: Most popular browser for link clicks
- Safari: High usage on mobile devices
- Firefox: Privacy-focused users
- Edge: Windows users and enterprise environments
- Other Browsers: Niche browsers and custom solutions
Device Analytics
Track device preferences and optimize accordingly:
- Mobile Devices: Smartphones and tablets
- Desktop Computers: Traditional computing devices
- Operating Systems: iOS, Android, Windows, macOS, Linux
- Screen Sizes: Responsive design optimization data
Device Optimization Strategies
- Optimize content for your most popular devices
- Test link performance across different browsers
- Consider mobile-first design for high mobile usage
- Monitor for device-specific issues or opportunities
AI-Powered Performance Intelligence
yLnk's Analytics Dashboard uses artificial intelligence to provide intelligent insights beyond basic statistics. The AI system analyzes patterns, predicts trends, and provides actionable recommendations.
AI Intelligence Features
- Performance Scoring: AI-calculated performance scores based on multiple factors
- Trend Prediction: Forecast future performance based on historical data
- Anomaly Detection: Identify unusual patterns and potential issues
- Optimization Recommendations: AI-suggested improvements for better performance
- Pattern Recognition: Identify successful content patterns and strategies
AI-Powered Insights
- Content Optimization: AI suggests improvements based on successful patterns
- Timing Recommendations: Optimal posting times based on audience behavior
- Audience Insights: Deep understanding of your audience preferences
- Campaign Intelligence: Predict campaign success and optimize strategies
Understanding AI Recommendations
The AI system provides actionable insights in several categories:
- Content Strategy: Recommendations for content types and formats
- Timing Optimization: Best times to post and share content
- Audience Targeting: Geographic and demographic optimization
- Platform Strategy: Which platforms work best for your content
Advanced Date Filtering
Advanced Date Filtering allows you to analyze performance over specific time periods, helping you understand seasonal patterns, campaign effectiveness, and growth trends.
Date Range Analysis
- Custom Date Ranges: Select any start and end dates for analysis
- Maximum 10 Days: Detailed analysis with up to 10-day ranges
- Comparative Analysis: Compare different time periods side by side
- Seasonal Patterns: Identify recurring trends and cycles
Date Filtering Best Practices
- Use consistent date ranges for accurate comparisons
- Analyze performance before and after major events
- Compare weekday vs. weekend performance
- Track performance during different seasons
Use Cases for Date Filtering
Date Analysis Applications
- Campaign Analysis: Measure campaign performance over specific periods
- Seasonal Trends: Understand seasonal variations in engagement
- Growth Tracking: Monitor performance growth over time
- Event Impact: Analyze the impact of specific events on traffic
Best Practices & Optimization
To get the most out of yLnk's Analytics Dashboard, follow these best practices:
Regular Monitoring
- Daily Check-ins: Monitor performance daily for immediate insights
- Weekly Analysis: Conduct deeper analysis on a weekly basis
- Monthly Reviews: Comprehensive monthly performance reviews
- Alert Setup: Set up notifications for unusual activity
Data-Driven Decision Making
- Use Analytics to Guide Content: Create content based on what performs well
- Optimize Based on Trends: Adjust strategies based on trend analysis
- Test and Iterate: Use data to test different approaches
- Focus on High-Performing Content: Replicate successful patterns
Performance Optimization
- Geographic Optimization: Tailor content for your top-performing regions
- Timing Optimization: Post content during peak activity times
- Platform Strategy: Focus on platforms that drive the most engagement
- Content Refinement: Continuously improve based on performance data
Real-World Use Cases
Here are practical examples of how businesses and creators use yLnk's Analytics Dashboard:
E-commerce & Retail
E-commerce Analytics Use Cases
- Product Launch Tracking: Monitor performance of new product links
- Campaign ROI Analysis: Track marketing campaign effectiveness
- Geographic Expansion: Identify new markets with high engagement
- Seasonal Optimization: Adjust strategies based on seasonal trends
Content Creators & Influencers
Creator Analytics Use Cases
- Content Performance: Identify which content types perform best
- Audience Insights: Understand audience demographics and preferences
- Platform Optimization: Focus on platforms that drive engagement
- Growth Tracking: Monitor audience growth and engagement trends
Marketing & Advertising
Marketing Analytics Use Cases
- Campaign Performance: Track and optimize marketing campaigns
- Lead Generation: Monitor lead source effectiveness
- A/B Testing: Test different approaches and measure results
- ROI Measurement: Calculate return on investment for different strategies
Business & Enterprise
Business Analytics Use Cases
- Internal Communications: Track employee engagement with company links
- Client Portal Analytics: Monitor client resource usage
- Event Marketing: Track event registration and engagement
- Brand Monitoring: Track brand mention and link performance
Ready to Master Your Analytics?
Start using yLnk's Analytics Dashboard today and gain deep insights into your link performance. All analytics features are completely free with no limitations.
Share this guide with your team and start making data-driven decisions today!